Statistical Modeling Approaches for Spotting Discrepancies in Market Pricing Across Athletic Competitions
Taylor Koch · Aug 18, 2026

Statistical Modeling Approaches for Spotting Discrepancies in Market Pricing Across Athletic Competitions
Statistical modeling plays a central role in identifying pricing discrepancies within markets tied to athletic competitions, where odds and related values fluctuate based on incoming data from events like football matches, tennis tournaments, and horse racing fixtures. Researchers apply quantitative techniques to compare expected outcomes against observed market prices, revealing instances where models and real-time figures diverge. These methods draw on historical performance records, participant statistics, and environmental factors to generate baseline projections that highlight potential mismatches.
Core Techniques in Regression-Based Analysis
Linear and logistic regression models form foundational tools for examining how variables such as team form, player injury reports, and venue conditions influence pricing structures across different sports. Analysts feed large datasets into these frameworks to estimate probabilities, then cross-reference results with current market quotes to flag deviations that exceed statistical thresholds. Multiple regression extends this process by incorporating several predictors simultaneously, allowing observers to isolate which factors drive the largest gaps between projected and listed values.
Studies from academic institutions demonstrate that regression outputs improve when datasets expand to include granular details like in-game metrics and weather impacts, particularly in outdoor athletic events scheduled during peak summer periods. In August 2026, updated datasets from major competitions incorporated refined variables that sharpened model accuracy for events spanning multiple continents.
Time Series and Volatility Models
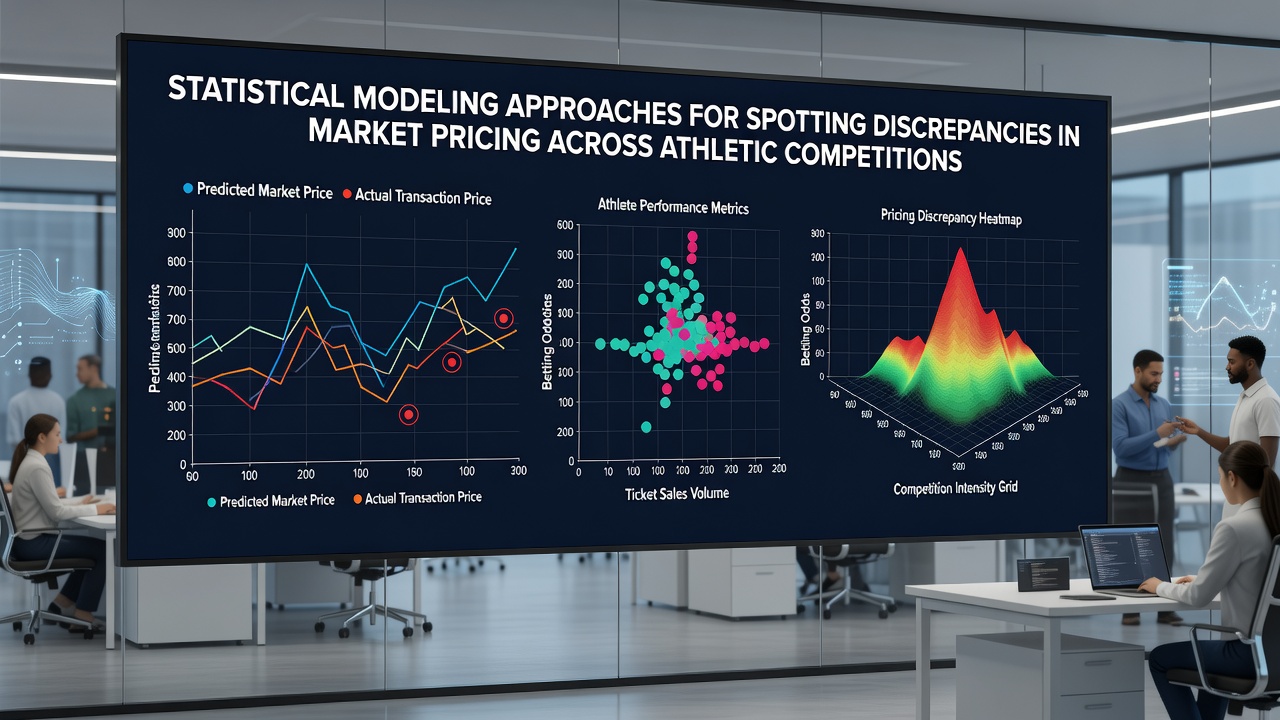
Time series approaches such as ARIMA and GARCH capture how pricing evolves before and during athletic competitions, accounting for sudden shifts triggered by live developments. These models process sequential data points to forecast future price movements, enabling detection of anomalies when actual trajectories stray from predicted paths. Observers note that volatility clustering often appears in high-stakes matches where information arrives rapidly, creating temporary windows where modeled expectations and market prices separate noticeably.
Applications extend to horse racing circuits and tennis circuits alike, where pace of play and scoring bursts generate distinct temporal patterns. Data indicates these models gain precision when calibrated against multi-year records rather than isolated seasons, producing more reliable signals for discrepancy identification.
Machine Learning Integration for Complex Patterns
Supervised learning algorithms including random forests and gradient boosting machines handle nonlinear relationships that traditional regression overlooks, processing features like head-to-head histories and betting volume trends to classify pricing as aligned or discrepant. Unsupervised methods such as clustering group similar competition scenarios, surfacing outliers that warrant further scrutiny. Neural networks add depth by modeling interactions across dozens of inputs, though they require substantial computational resources and careful validation to avoid overfitting on noise within athletic datasets.
Research published through the National Bureau of Economic Research illustrates how ensemble techniques combining multiple algorithms reduce false positives when scanning across football leagues, tennis grand slams, and racing meets. These approaches prove especially useful during condensed schedules where overlapping events produce correlated price movements.
Data Sources and Validation Practices
Comprehensive datasets originate from official competition organizers, statistical agencies, and aggregated market feeds that compile odds from numerous operators. Validation typically involves backtesting models against past events to measure how often flagged discrepancies corresponded to actual outcomes, refining parameters for ongoing use. Cross-validation across different sports helps confirm whether a given technique generalizes or remains sport-specific.
Figures from regulatory bodies in various regions, including reports coordinated through the Australian Gambling Regulation Authority, show increasing adoption of standardized data formats that facilitate model comparisons between markets. This standardization supports more consistent identification of pricing inconsistencies when events occur simultaneously in different time zones.
Challenges in Implementation
Model performance depends on data quality and timeliness, with gaps in reporting or delays in updates introducing errors that mask or fabricate apparent discrepancies. Overfitting remains a persistent concern when algorithms capture random variation instead of genuine market signals, while changing rules or participant eligibility can render older training data less relevant. Analysts address these issues through regular recalibration and incorporation of real-time feeds that reflect the latest developments in athletic competitions.
Seasonal factors also influence results, as summer schedules in 2026 introduced additional variables around heat acclimation and recovery periods that affected performance baselines across several disciplines. Models incorporating these elements produced tighter alignment with observed pricing in subsequent evaluations.
Conclusion
Statistical modeling approaches continue to evolve as computational power and data availability expand, offering structured ways to examine pricing dynamics across athletic competitions. Regression, time series, and machine learning methods each contribute distinct capabilities for surfacing discrepancies, while robust validation and diverse data sources strengthen their reliability. Ongoing refinements ensure these techniques adapt to new competition formats and information streams that shape market behavior in the years ahead.