Betting Odds Comparison: Navigating Market Variations Across Platforms
Taylor Koch · Aug 21, 2026

Betting Odds Comparison: Navigating Market Variations Across Platforms
Betting odds comparison involves examining price differences offered by various operators on the same event or outcome, and those who study these patterns note that even minor variations can accumulate over multiple selections. Operators calculate odds based on statistical models, historical data, and real-time adjustments, while platforms that aggregate these figures allow users to identify where value may exist without requiring manual checks across dozens of sites. Research from industry reports shows that odds can shift by several percentage points between bookmakers due to differing risk assessments and promotional strategies.
How Odds Differ Between Operators
Bookmakers set initial lines using proprietary algorithms that factor in probabilities, market liquidity, and expected margins, and observers have documented cases where one platform prices a particular result at 2.10 while another lists it at 2.30 for identical conditions. These discrepancies arise because each operator manages its own book and responds to incoming bets at different speeds, which creates windows for comparison tools to highlight advantages. Data indicates that margins typically range between 2 and 5 percent on major markets, yet individual events can see wider spreads when liquidity is lower or when external news alters perceived probabilities.
Key Factors That Drive Variations
Market volume plays a central role since high-liquidity events attract more aggressive pricing from competing firms, whereas niche propositions often display larger gaps because fewer operators offer them. Regulatory environments also influence pricing, and analysts point to differences in tax structures across jurisdictions that affect the final odds presented to customers. Weather updates, team news, and late roster changes prompt rapid recalculations, and comparison services track these movements to show which sites have updated first. Studies conducted by academic researchers reveal that timing matters as much as the raw numbers, with odds sometimes improving within minutes of new information reaching the market.
Those who monitor multiple platforms report that promotional overlays such as enhanced odds or cash-back offers can further alter the effective price, and these incentives appear most frequently around major calendar events. In August 2026 several international tournaments are scheduled to begin, and early line comparisons already show operators adjusting their margins in anticipation of increased betting volumes during that period.
Tools and Aggregators in Practice
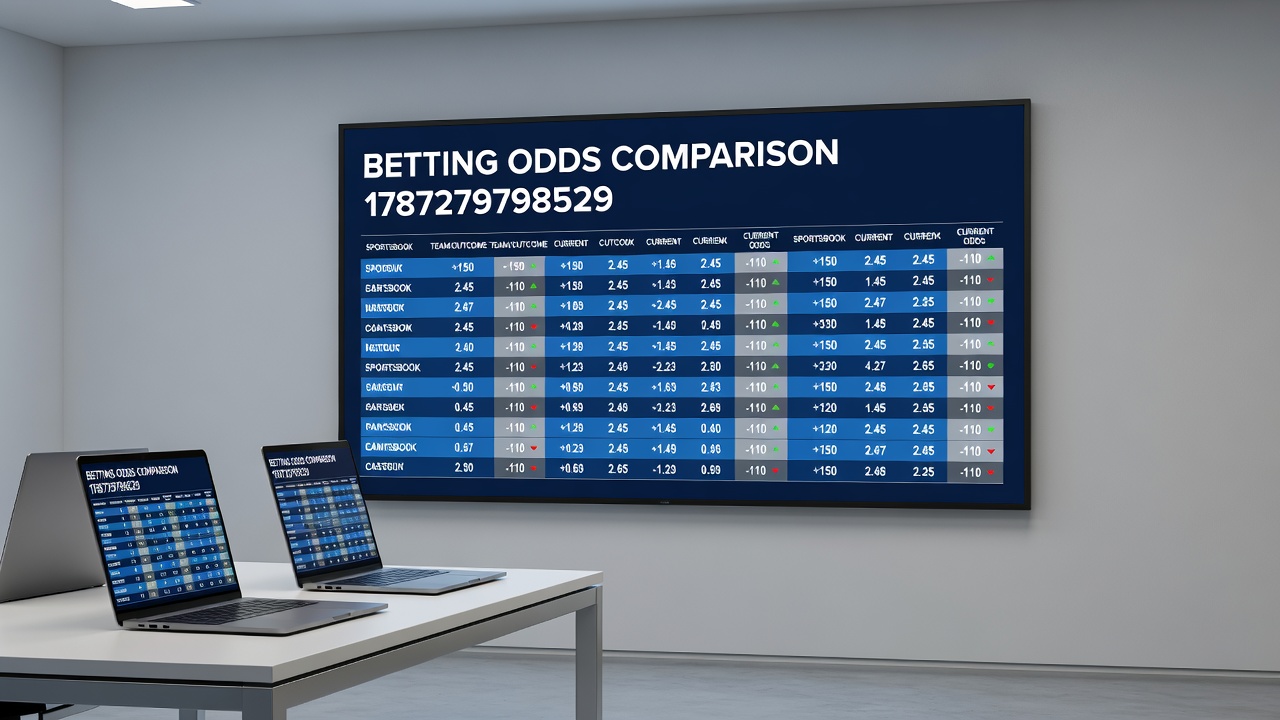
Specialized websites and mobile applications compile live prices from dozens of operators into single interfaces, and users can filter by sport, market type, or payout percentage to locate the highest available figures quickly. These services rely on direct data feeds from bookmakers, which update continuously, and the resulting tables allow side-by-side evaluation without switching between separate sites. Industry organizations note that adoption of such aggregators has grown steadily as more jurisdictions legalize online betting and increase the number of licensed operators.
One documented example involves a researcher who tracked tennis match odds across ten platforms during a single tournament and found that the best price moved between three different bookmakers within the first hour of trading. Similar patterns appear in other categories, and the ability to switch between operators based on live comparisons has become a documented strategy among frequent participants. Automated alerts now notify users when a selected outcome reaches a predetermined threshold, reducing the need for constant manual monitoring.
Regional Regulatory Influences
Authorities in different regions impose distinct requirements on operators, and these rules indirectly shape the odds available to local customers. Reports from the Pennsylvania Gaming Control Board illustrate how tax rates and licensing fees can compress margins on certain products, while other jurisdictions maintain lighter oversight that permits wider pricing competition. Canadian provincial frameworks provide another point of reference, with data from regulatory filings showing that operator density correlates with tighter spreads on popular markets.
Academic papers published by university economics departments have examined these cross-border differences and concluded that greater competition generally leads to improved prices for participants, although the effect varies by market size and event popularity. Observers note that emerging markets in Asia and Latin America are beginning to publish their own regulatory statistics, which future comparison analyses will incorporate as more data becomes available.
Practical Applications of Comparison Data
Participants use aggregated information to construct selections that maximize potential returns while staying within their preferred risk parameters, and case studies compiled by research groups demonstrate measurable differences in long-term outcomes when systematic comparison replaces single-site betting. Software developers continue to refine scraping and display technologies that handle increasing data volumes without latency, and these improvements support faster decision-making during live events.
Figures released by trade associations indicate that average payout percentages have risen slightly in markets with high aggregator usage, suggesting that visible competition encourages operators to remain competitive. Yet the same reports caution that promotional terms and withdrawal conditions must also be reviewed alongside the headline odds to obtain an accurate picture of overall value.
Conclusion
Betting odds comparison remains a data-driven process that relies on timely information from multiple sources, and continued growth in regulatory transparency across regions is expected to expand the scope of available analysis. As platforms refine their aggregation methods and more operators enter licensed markets, the range of prices available for any given outcome continues to evolve. Those who track these developments through established tools gain access to the most current figures, while regulatory updates scheduled for 2026 and beyond will likely introduce additional variables into the comparison landscape.